Data Visualization
Welcome to the DataGurus Data Visualisations, where data comes to life, transforming into actionable insights through the art of visualisation.

In today’s data-rich landscape, the ability to convey complex information with clarity and precision is paramount. At DataGurus, we are your trusted partners in crafting custom visualisations, leveraging tools like Power BI, Tableau, R programming, and Python to unlock the potential of your data.
Our team of data visualisation specialists is dedicated to the art of storytelling with data. We combine creative flair with technical proficiency to create visuals that not only look stunning but also communicate the core message effectively.
Power BI is a dynamic tool for turning raw data into compelling visual narratives. We specialise in Power BI, crafting interactive dashboards, reports, and data stories that allow you to explore and understand your data like never before. From simple charts to complex interactive reports, we have the expertise to transform your data into actionable insights.

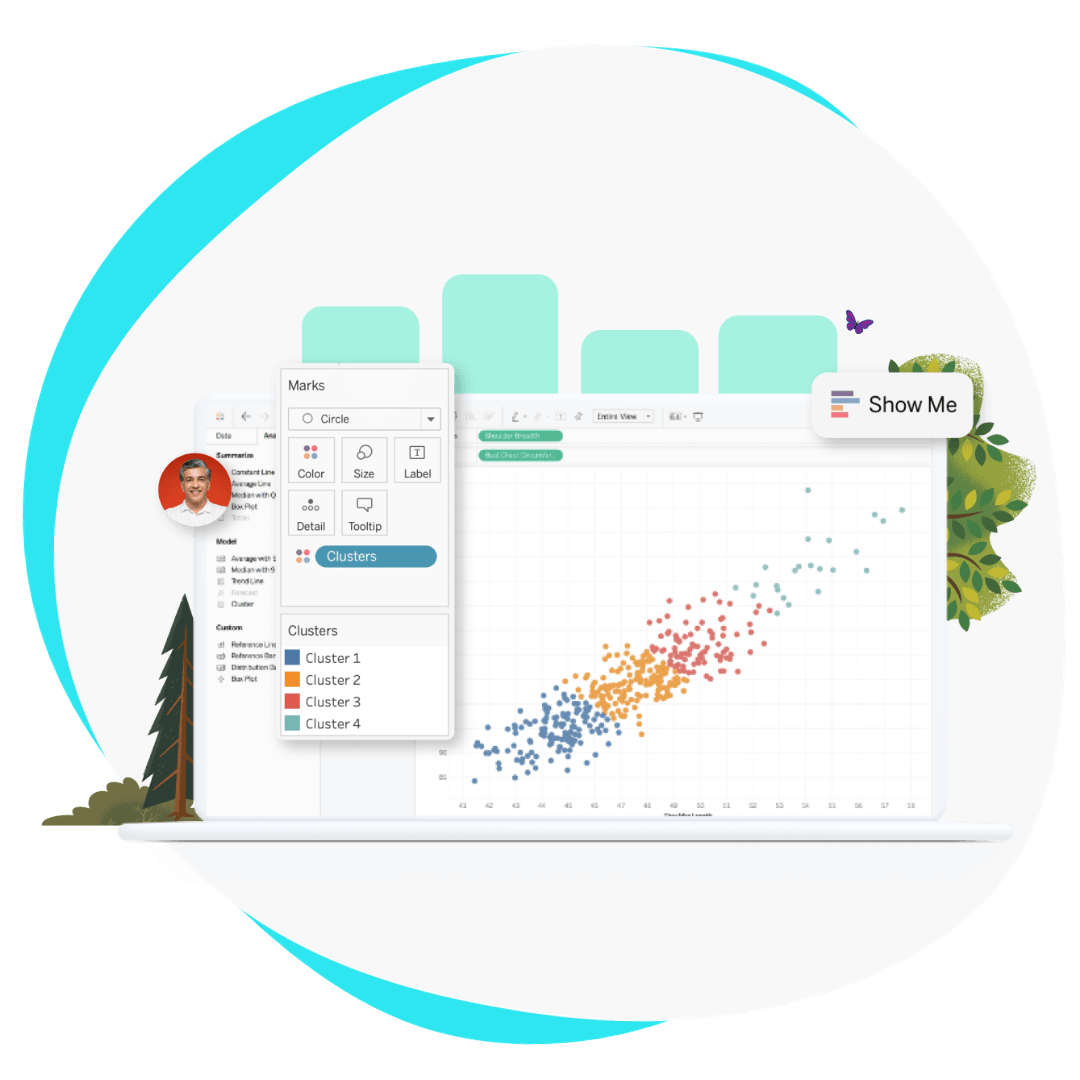
Tableau is renowned for its ability to transform data into captivating stories. Our Tableau experts can create interactive and shareable dashboards and reports that empower your team to make data-driven decisions. We know how to leverage Tableau’s capabilities to provide clarity and insight.

R programming offers a wealth of possibilities for customised visualisations. Our R experts can create bespoke visuals tailored to your specific needs, whether it’s for statistical analysis, data exploration, or data representation. We harness the power of R to ensure your visualisations are not just insightful but also precise.

Python’s versatility extends to data visualisation. Our Python specialists can craft a wide range of visualisations, from basic charts to complex, interactive graphics. Whether it’s data exploration, machine learning results, or geographical mapping, we use Python to deliver visualisations that convey the information you need.
We combine creative flair with technical expertise to craft visualisations that are both aesthetically pleasing and informative.
Our specialists are experts in Power BI, creating interactive dashboards and reports to unlock the power of your data.
We leverage Tableau’s capabilities to create shareable dashboards that empower data-driven decision-making.
Our use of R programming ensures that visualisations are customised to your precise needs.
From basic charts to complex graphics, our Python visualisations cover a wide range of needs.
We understand that every client is unique, and we tailor our visualisations to meet your specific requirements.
We have an amazing support team waiting to answer your queries. Shoot up your queries and we will get back to you with best possible solution.